
Chris Manglitz
is looking for work - creating Business Solutions with data
I am an Economist & Data Scientist using causal inference, experimentation, and machine learning to turn data into decisions.
I design data-driven frameworks to measure impact — from ad effectiveness to public policy — blending econometrics, creativity, and clear communication.
Skills
I like to use data to answer interesting questions. Every database has a story to tell (probably tons of stories)!
I like to dig into the gritty details with technical professionals, but I also love breaking it down to what actually matters so even my 7 year old son gets it.
ETL / Data Cleaning and Wrangling
Program Evaluation / Ad-lift / Simulations / Forecasting / Machine Learning
Data Visualizations, Graphics, Dashboards, Presentations and Reports
SAS / Stata / SQL / Python / Tableau / Power BI

GeoLift: Geo-based Synthetic Control Matching for Ad-Lift
As a case study for measuring advertisement lift for a large food distributor, I turned to Python libraries numpy/pandas/matplotlib/scipy.
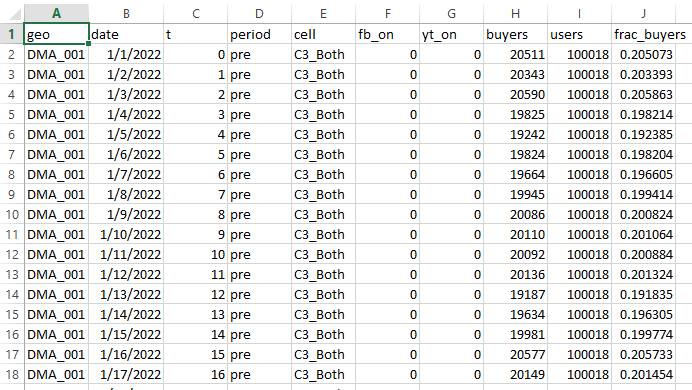
I created a synthetic geo panel dataset with seasonality trends. Then I modeled a GeoLift-style measurement technique:
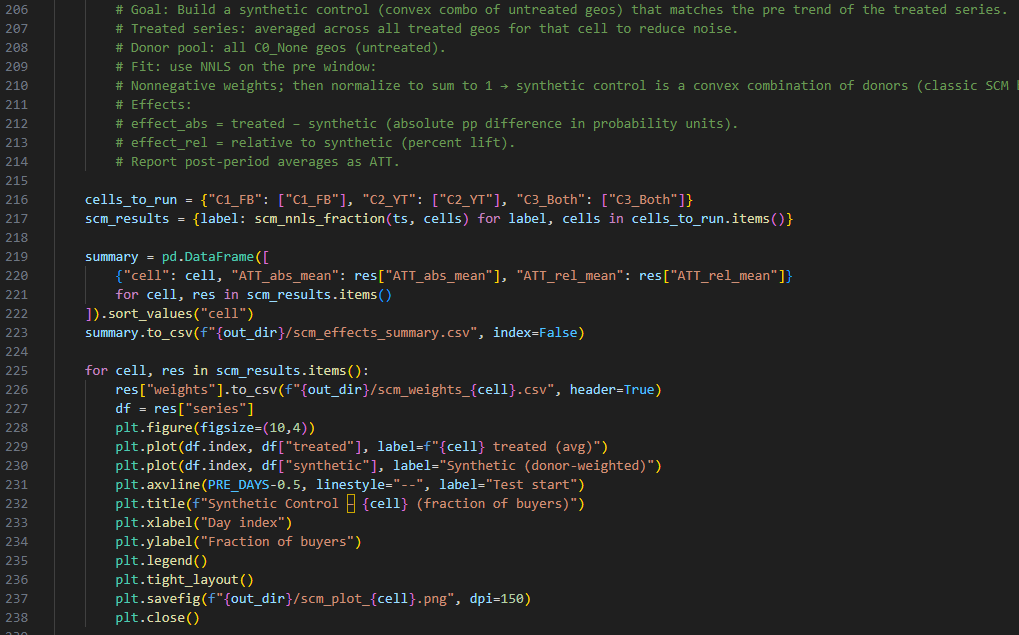
synthetic control (convex combo of untreated) as donors
used nonnegative least squares on the pre-window, normalized to sum weights to 1
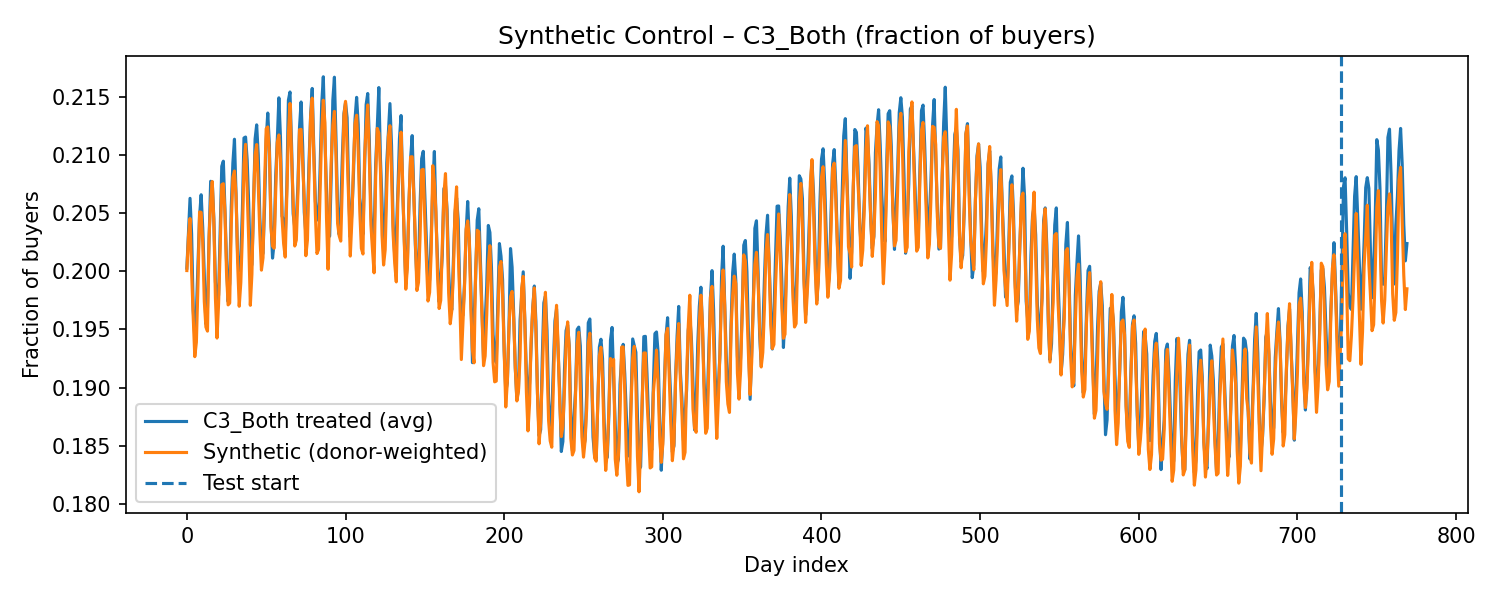
difference between treated and untreated geos clearly shown in post-treatment
high robustness, high measurement accuracy
2% increase in sales through a combination of FB and YT digital campaigns
Handling Data Challenges: Child Welfare Cost Effectiveness Evaluation
The California Department of Social Services needed to assess the effectiveness of providing flexible funding to different counties’ Child Welfare departments, in the hopes of improving family stability and preventing foster care outcomes.
I was the cost study lead, determining the analytic approach and tasked with harmonizing the different counties’ data, determining valid metrics of comparison, running analysis and evaluation, and generating tables and visualizations into a detailed data report and recommendations.
The project had several technical challenges, such as significant differences between counties, including data systems, population demographics and sizes, and the implemented Title IV-E programs.
Properly accounting for and managing these differences was key in appropriately measuring the causal-effects of the increased flexible funding by county.

I have experience analyzing data for numerous Federal clients (DoD, VA, USDA-FNS, DOL) as well as private companies (CareFirst BCBS, WWP).
I’ve worked with survey data, health care and claims data (CMS, VA-Vinci), financial data, labor and employment data, stock market data, and more.
I have experience doing data ETL pipeline work - extractions, merging, cleaning, harmonization, Regex free-text cleaning.
Data Dashboards and Visualizations
in Power BI and Tableau
I love making data visualizations! There is no better way for a human brain to absorb information from data.
PowerQuery transformations on API data pulls -> real-time measures and KPIs -> interactive data dashboards
I can take you from database to insight to business decision.
Skills and Work History
Data Science / Econometrics / Quantitative Analysis
Data Visualizations / Dashboards
SQL / Python / Stata / SAS / Tableau / Power BI
2008-2025 : Economist and Data Analyst at Westat
December 2025 : For Hire